Core Web Vitals: What Google Really Counts for Your Website
According to a joint study by Google and Deloitte, improving page load time by just 0.1 seconds increases conversion rates in e-commerce by an average of 8.4 percent. For B2B websites, the effect is comparable — though harder to measure directly.
Since June 2021, Core Web Vitals have been an official Google ranking factor. Three specific metrics now help determine whether your page ranks at the top of search results or disappears onto page two — regardless of backlinks, content, and classic technical SEO.
What exactly these metrics measure, where to find your own scores, and what you can concretely improve: you'll find all of that here.
What are Core Web Vitals?
Core Web Vitals are three defined metrics that Google uses to evaluate the real-world user experience of a website. Not loading time in general — but three precise moments in the page load that correlate directly with the behavior of real users.
The metrics are based on real user data — not a test environment, but Chrome browser data collected from real users over a rolling 28-day period. That makes them one of the most meaningful quality signals Google currently uses for ranking.
The three metrics — explained concretely
LCP: Largest Contentful Paint
LCP measures how long it takes for the largest visible element on a page to fully load. In most cases, that's a hero image, a large banner, or the main headline.
The most common causes of a poor LCP score: images without compression or in the wrong format (JPEG instead of WebP or AVIF), missing Content Delivery Network (CDN), fonts that block rendering, and slow server response time exceeding 200 milliseconds.
INP: Interaction to Next Paint
INP measures how quickly a page responds to user input — clicks, taps, or keyboard interactions.
Important: INP replaced the old metric FID (First Input Delay) as an official Core Web Vital in March 2024. Unlike FID, which only measured the very first interaction in a session, INP evaluates all interactions. That makes it far more meaningful for pages with heavy user interaction — and means: many guides online are now outdated on this topic.
Thresholds: ≤ 200 milliseconds = good · 200–500 ms = needs improvement · > 500 ms = poor
Most common causes: too much JavaScript blocking the main thread, and third-party scripts running with delay — chat widgets, Google Tag Manager, social embeds.
CLS: Cumulative Layout Shift
CLS measures how much the visible page content shifts during loading. You know the feeling: you're about to click a button — and at that exact moment a banner loads in, the button jumps down, and you click nothing.
The CLS score is a cumulative value across all shifts during an entire session. Common causes: images and videos without defined width and height in the HTML, web fonts that load late and shift text, and ads or widgets without a fixed reserved space.
The most common mistake: why a good PageSpeed Score can mislead you
This is one of the biggest misconceptions around Core Web Vitals.
PageSpeed Insights and Lighthouse measure in a controlled lab environment — with defined device and network profiles. That provides useful diagnostic data. But it is not what Google uses for ranking.
For ranking, what counts is Field Data — real user data from the Chrome User Experience Report, or CrUX. This data is collected on a rolling 28-day basis and reflects how your page performs on real devices, with real connection speeds.
The result: a page can score 95 in the PageSpeed test and still have poor CWV field values — because a large share of users are on mid-range mobile devices or weak mobile connections.
According to the HTTP Archive Web Almanac 2024, fewer than 45 percent of all analyzed websites meet the "Good" thresholds for all three Core Web Vitals on mobile — despite growing awareness of the topic.
What this means for you: Google Search Console is your most important tool — not PageSpeed Insights. Because Search Console shows you the CrUX field values that Google actually uses for your ranking.
Where to find your CWV scores — the right tools
Tool
Data type
When to use
PageSpeed Insights
Lab + Field (when available)
Initial diagnosis, identifying causes
Google Search Console
Field Data (CrUX, 28 days)
Official basis for rankings
CrUX Dashboard (Looker Studio)
Field Data, historical
Trend tracking over time
Chrome DevTools / Lighthouse
Lab
Developer debugging of individual pages
Getting started is simple: open Google Search Console, navigate to "Experience" → "Core Web Vitals" and see how many of your URLs are rated as "Poor", "Needs improvement", or "Good" — broken down by desktop and mobile.
Pages rated as "Poor" are penalized by Google in rankings compared to similar pages with good CWV scores. With equal content and equal backlink profiles, the faster page wins.
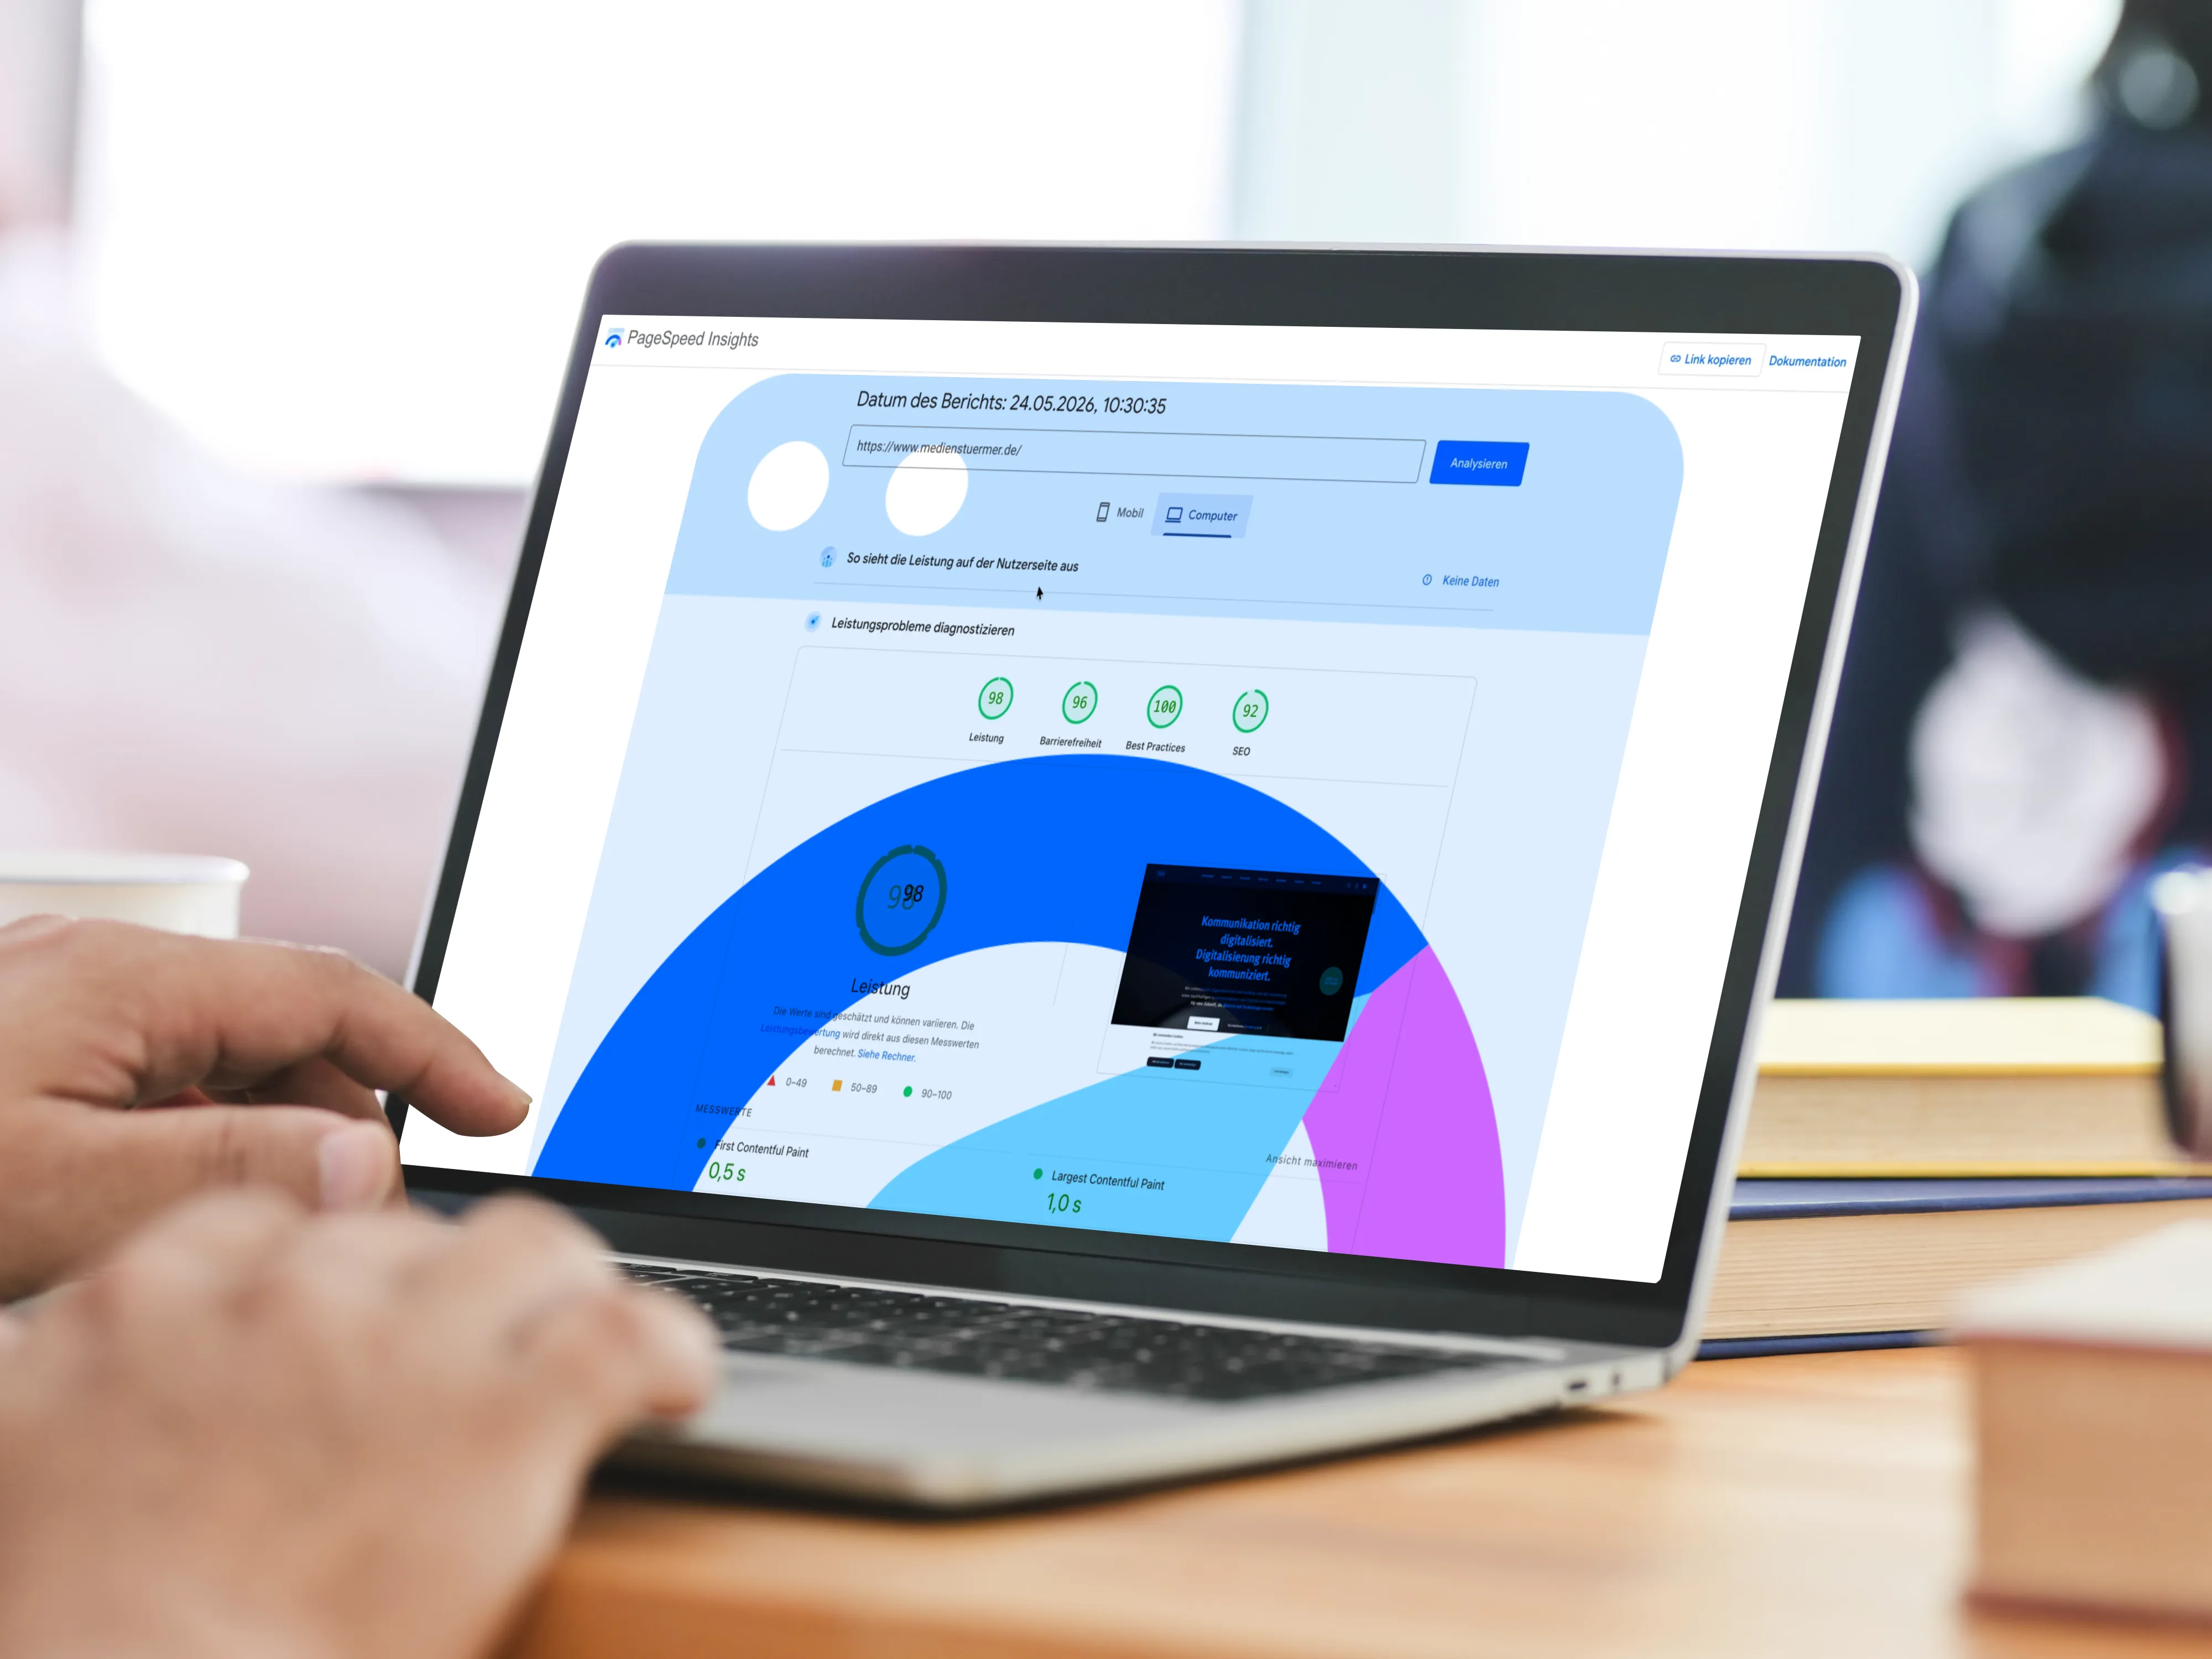
Test your own site
Enter your domain and check it directly with Google PageSpeed Insights.
Opens pagespeed.web.dev (Google) in a new tab.
Checklist: what you can check today
Without developers — immediately:
Open Search Console → Core Web Vitals Report → Which URLs are marked red?
Run PageSpeed Insights for your most important pages: homepage, service pages, contact page
Check mobile first — CWV thresholds are primarily evaluated based on mobile user data, even if your target audience is mainly on desktop
Assess load time yourself: open the page in incognito mode on a mobile device on a mobile network — what do you see first?
With technical support — systematically:
Images: WebP or AVIF format, srcset for different resolutions, width and height defined in HTML?
The LCP element (usually the hero image) should have fetchpriority="high" and no lazy loading
Fonts: font-display: swap set, fonts hosted locally instead of loaded via Google Fonts CDN?
JavaScript: which third-party scripts block rendering? Chat widgets, Tag Manager, and social embeds are frequent culprits
Hosting: CDN active? Server response time under 200 ms?
When does professional optimization pay off?
The short answer: when multiple pages in the CWV report are marked red and the bounce rate on mobile is significantly higher than on desktop, systematic optimization makes sense.
A Portent study (last updated 2022) shows: websites that load in under one second have a conversion rate three times higher (in B2B) than pages with five seconds load time. In B2C e-commerce, the factor is around 2.5.
That doesn't mean every page needs a full performance optimization. But for businesses where every qualified lead counts, website performance is one of the few SEO measures with directly measurable business impact.
Google's own data confirms this: websites that meet all CWV thresholds show 24 percent lower abandonment rates than pages that miss the thresholds.
As a decision-maker, the goal isn't to improve a technical score — it's to keep more users on your page, clicking through, and converting.
Frequently asked questions about Core Web Vitals
Are Core Web Vitals an official Google ranking factor?
Yes — since June 2021, Core Web Vitals have been part of what Google calls Page Experience Signals. They feed into the ranking evaluation together with other user signals (HTTPS, mobile optimization, no intrusive interstitials). They are not the sole determining factor, but with comparable content and backlink profiles, they can make the difference between positions on page one.
How do Core Web Vitals differ from PageSpeed?
PageSpeed (measured by Lighthouse or PageSpeed Insights) is a lab score — it simulates a page load under controlled conditions. Core Web Vitals are based on real user data from the Chrome User Experience Report. For Google ranking, field data counts — not the lab score.
What is INP and why did it replace FID?
INP (Interaction to Next Paint) measures how quickly a page responds to all user interactions during a session. FID (First Input Delay) only measured the very first interaction, making it less meaningful for complex pages. INP has been an official Core Web Vital since March 2024. If your last CWV audit is more than a year old, it's worth a fresh review.
How long does it take for improvements to show up?
CrUX data is calculated on a rolling 28-day basis. Even if you implement all technical improvements today, it takes four to six weeks before they fully show up in Search Console scores — and therefore in rankings.
Can I improve Core Web Vitals myself?
Analysis is possible without technical expertise — Search Console and PageSpeed Insights are free. However, implementing most improvements (image optimization, JavaScript auditing, server configuration) requires development expertise. Exception: if you use a common CMS like WordPress, caching and image optimization plugins can deliver initial improvements without developers.
Are your most important pages showing red or yellow CWV scores in Search Console — and you're not sure where to start?
In a free 30-minute initial consultation, we'll look at your data together and show you which measures will have the greatest impact.